
When it comes to delivering food to customers through an app, on-time delivery matters the most. Munchies, a Pakistani e-commerce snacking solution, was founded in 2019 by Unilever and VentureDive with the aim of delivering snacks instantly to customers using an app. The app would allow them to choose from a variety of snacks including ice cream, chips, chocolates, and more.
Being the only on-demand delivery app for snacks in Pakistan, Munchies got the attention of consumers quickly and began receiving a reasonable amount of orders daily. However, it had to face challenges with on-time delivery as well as updating the customer on an accurate Estimated Time of Arrival (ETA). In other words, the Estimated Time of Arrival (ETA) for Munchies was longer than expected.
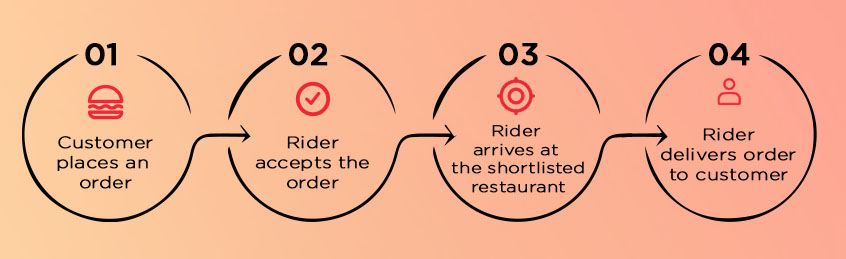
Munchies’ on-demand delivery system
Similar to other on-demand delivery apps for the food industry, Munchies was designed to focus on customers, stores, and riders. Whenever a customer would place an order, a rider would be sent a request to accept the order. After a rider accepts the order, a store is shortlisted for picking up the order items. When all of the order items have been collected, the rider will be ready to depart for the drop-off location and deliver the order to the customer. The figure below shows the current dispatch system.
Problems with Munchies snack delivery workflow
While the on-demand delivery flow looked manageable, it had many unforeseen complexities. In a hypothetical situation, if an item is not available at the store, then the rider might need to ask the customer to either cancel that item or go to another store, which will result in an increased ETA. Similarly, the larger the basket size (number of items in an order) of an order, the larger the time to collect all these items. Another reason for altering the ETA could be the long lines at stores given the Covid-19 pandemic.
The current system that estimated the time of arrival was Google Maps, i.e., the Google Distance Matrix API, which simply estimated the time from order acceptance to arrival at the store and then from the store to the drop-off location of the customer. The total ETA is simply the sum of these two plus a fixed buffer of a few minutes. While Google is no doubt an efficient system to get ETAs, for Munchies, it just concentrated on the longitude and latitude of the rider, store, and customer’s dropoff location. It was not aware of the workings of Munchies and all the complexities discussed above.
The obstacle was that Google was providing an accurate ETA for the latitude and longitude pair, giving a time of 25 minutes, but because of the workings and structure of Munchies, an order would, almost all of the time, take longer than what Google had provided. All this was not leaving a good impression on the customer. Another reason for the longer ETA was that there were a lot of orders in some areas but only a few stores. This prompted the suggestion that some stores be added in order to reduce ETA and deliver faster.
VentureDive’s strategy to resolve the ETA prediction issue
In order to solve this obstacle, the data science team at VentureDive was put in charge of digging deeper and coming up with a viable solution.
After a thorough analysis of the data with respect to ETA, the team identified a number of key problems with using Google Maps. The main problem highlighted was that while Google is aware of the traffic conditions and the roads of the city, it knows nothing about the internal operations of Munchies. For example, there might be a specific area in the city that takes longer, or there might be some specific stores responsible for a longer ETA. The data of the orders at Munchies was being stored on a daily basis but Google does not consider any of the data recorded for predicting ETA except latitudes and longitudes.
The main purpose was to make use of the historical data we had at our disposal to predict the ETA. The team provided a solution that was simple but efficient. An in-house system (a prediction model) that will predict ETA for orders.
Benefits of accurate ETA prediction for on-demand delivery
The benefit of using this solution is that we will be using several more features to predict ETA than just latitude and longitude. The following are the features:
- Time & Location
When an order is placed, we can tell our prediction system that the order is for this specific area or store respectively. - Basket size
We can also specify the basket size (the number of items in an order or even the rider information or vehicle type. - Weather
We can add weather data which, of course, has an impact on delivery time.
The foremost benefit of having an in-house prediction system is that, since it will be using historical data, it will automatically take into account all those complexities that we discussed above. It was also cost-efficient and entirely under our control. We had the ability to make changes as needed, which Google Maps does not provide.
Building the ETA Prediction solution to enable on-time deliveries
Munchies’ on-demand delivery model was designed in such a way that cities are divided into service areas, and each service area has its own dedicated fleet of delivery that was instructed to remain near the restaurants to make delivery as quick as possible.
The team started by exploring the data and analyzing it specifically in terms of ETA. Data was already being collected from the app, so the data acquisition stage was relatively simple. In the analysis phase, the team’s research came up with some interesting insights. Three pieces of research highlighted that there were some areas in the city that were constantly taking longer than expected. Similarly, orders from some stores were also taking too long to deliver. The most fascinating find was the dispatch algorithm currently in use could be improved which would reduce the ETA.
After all the thorough research and solutions, now it was time to start building a machine learning model that would be trained on order data and then used to predict the ETA of future orders. In order to build this model, the team did processing on the data which included the:
- Feature Engineering
The data had some timestamp features, so a month, day, week, hour, or even minute and seconds can be extracted from a single DateTime feature which can possibly add to the model’s performance and data analysis.
- Outliers Detection and Removal
The real-world data is always disordered and comes with outliers, but not all machine learning models can handle them. Using statistical techniques, outliers were removed from the order data since it not only affects analysis but also the model’s performance as well.
- Missing Values
Another problem with real-world data is that it contains some missing values. The same was the case with our data. Again, with the help of statistical techniques, the team solved the problem of missing values. - Encoding
There were some features that were categorical in nature. Since many machine learning models cannot process categorical data, these features needed to be converted into numerical form, and for this reason, encoding techniques were used. - Drop Irrelevant Columns
Not all the features are important for a machine learning model. Columns like timestamps, Ids, etc. So these features can be dropped.
Once the data was filtered, meaning it had no outliers, missing values, or categorical features, it was time to move toward the machine learning part, where the data was first split into training, testing, and validation sets.
Overcoming the hurdles & challenges
One of the challenges in machine learning is choosing an appropriate machine learning algorithm. Since predicting ETA (continuous values) is a regression problem, we had to choose a regression algorithm. The most common choice was to go with XGBoost since it is widely used in the industry and usually outperforms other algorithms. Therefore, we tried three different algorithms, and XGBoost outperformed all other algorithms. We evaluated our models using regression metrics. A number of metrics could be used including RMSLE, RMSE, MAE, and R2 Score. We used some of these metrics for our case.
Initially, our models were not performing properly and there was an enormous error between the actual and the predicted values. This led to the hyperparameter tuning of models and which improved the results and reduced errors between the actual and predicted time of arrival.
One final step was to test the model in production. We deployed our model in production to see its comparison with the existing model. After months of comparison between the two, it turned out that an in-house solution was performing well in estimating arrival time by an adequate margin.
Conclusion
Long story short, with the help of data science and machine learning, our team was able to find the root cause of the problem. We provided viable solutions to the mobile app development team on how to reduce the ETA to enable timely, on-demand delivery of snacks and built an in-house model that started predicting accurate arrival times for orders. Ultimately we improved our customer experience in a cost-effective manner.


